

Modeling radio spectra of protostellar jets
Earth and Space Sciences
Protostellar jets serve as the principal signature of ongoing star formation activity. Observations have revealed that the radio emission from protostellar jets arise from a combination of thermal free-free and non-thermal synchrotron emission mechanisms. The observed radio spectra of protostellar jets can be explained with the help of emission models and we have developed, for the first time, a simplistic numerical model that is applicable for narrow as well as wide-angle protostellar jets, and could explain the signatures of synchrotron emission in their radio spectra. In addition, we introduce a lateral variation in the ionization fraction within the jet such that the jet is highly ionized along its axis and the ionization fraction decreases as a power-law with distance from the axis. The model geometry is such that the highly ionized regions close to the jet axis contribute to the majority of free-free emission and the outer edges that impact on the ambient medium result in the formation of astrophysical shocks where the conditions are suitable for the generation of synchrotron radiation along with free-free emission. We have studied the influence of each parameter on the characteristics of the model spectra and this enables us in estimating the parameters associated with the jets for which non-thermal emission was detected. The figure shown below represents the model jet geometry and illustrates the variation in flux densities across the length of the protostellar jet.
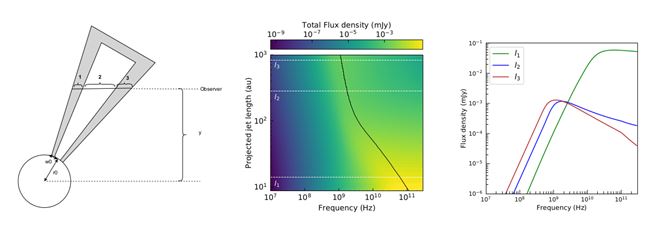
Caption: [Left] Schematic diagram of the jet representing the different layers of particle distribution along a specific line-of-sight at an arbitrary jet length projected on the sky plane (y). Regions 1 and 3 give rise to a combination of thermal and non-thermal emission, while Region 2 solely contributes to thermal emission. [Center] The flux density distribution (combined free-free and synchrotron) as a function of frequency (ν) and projected length (y) plotted in logarithmic space. The black curve represents the variation of the turnover frequency where emission is maximum. l1, l2 and l2 marked in white are three different positions along y, whose spectra are shown in [right].
Ref: Radio spectra of protostellar jets: Thermal and non-thermal emission, Sreelekshmi Mohan, S. Vig, S. Mandal, Monthly Notices of Royal Astronomical Society (MNRAS), 2022, 514, p3709–3724, DOI: 10.1093/mnras/stac1159